Graph Coloring Example
Graph Coloring assigns colors to the vertices of a graph such that no two adjacent vertices share the same color. It is NP-complete and has applications in scheduling, register allocation, and frequency assignment.
import getpass
import os

import numpy as np
from dotenv import load_dotenv
from luna_quantum.algorithms import SCIP

from luna_usecases.graph_coloring import (
    GraphColoringCollection,
    GraphColoringData,
    GraphColoringFormulation,
    GraphColoringInstance,
)

load_dotenv()
if "LUNA_API_KEY" not in os.environ:
    os.environ["LUNA_API_KEY"] = getpass.getpass("Enter your Luna API key: ")
Create Data
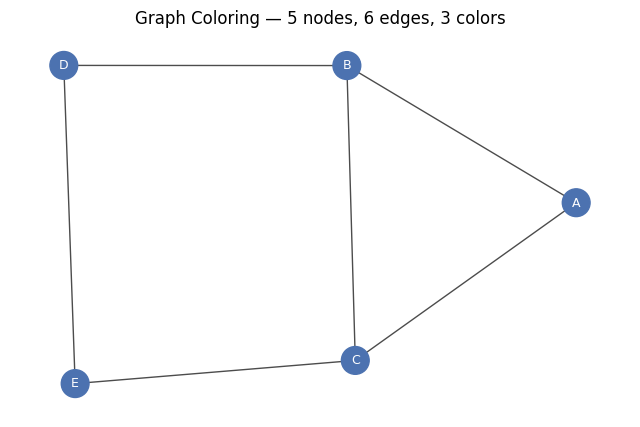
Define a 5-node graph and set 3 available colors.
adj = np.array(
    [
        [0, 1, 1, 0, 0],
        [1, 0, 1, 1, 0],
        [1, 1, 0, 0, 1],
        [0, 1, 0, 0, 1],
        [0, 0, 1, 1, 0],
    ]
)
node_names = ["A", "B", "C", "D", "E"]
data = GraphColoringData.from_adjacency_matrix(adjacency_matrix=adj, node_names=node_names, n_colors=3)
print(data.to_string())
Plot Data
Visualize the graph structure.
Create Formulation
Set up constraints ensuring adjacent nodes receive different colors.
Graph Coloring Formulation:
  Nodes: 5
  Colors: 3

Decision Variables:
  x[i,c] in {0,1} for i = 0, ..., 4, c = 0, ..., 2
  x[i,c] = 1 if node i is assigned color c
  Total: 15 binary variables

Objective:
  minimize 0 (feasibility problem)

Constraints:
  1. One color per node (5 constraints):
     sum_c x[i,c] == 1  for all i = 0, ..., 4
  2. Adjacent nodes get different colors (18 constraints):
     x[i,c] + x[j,c] <= 1  for all edges (i,j), c = 0, ..., 2
Create Instance
Combine data and formulation into a solvable instance.
Data:Graph Coloring Data:
  Nodes: 5
  Edges: 6
  Colors: 3
Formulation:Graph Coloring Formulation:
  Nodes: 5
  Colors: 3

Decision Variables:
  x[i,c] in {0,1} for i = 0, ..., 4, c = 0, ..., 2
  x[i,c] = 1 if node i is assigned color c
  Total: 15 binary variables

Objective:
  minimize 0 (feasibility problem)

Constraints:
  1. One color per node (5 constraints):
     sum_c x[i,c] == 1  for all i = 0, ..., 4
  2. Adjacent nodes get different colors (18 constraints):
     x[i,c] + x[j,c] <= 1  for all edges (i,j), c = 0, ..., 2
Formulate Model
Translate the instance into a mathematical optimization model.
Solve and Interpret
Solve the model with SCIP and interpret the raw result into a use-case-specific solution.
scip = SCIP()
job = scip.run(model)
sol = job.result()
uc_solution = instance.interpret(sol)
print(uc_solution.to_string())
/Users/maximilianjanetschek/PycharmProjects/luna-usecases/.venv/lib/python3.13/site-packages/rich/live.py:260:
UserWarning: install "ipywidgets" for Jupyter support
  warnings.warn('install "ipywidgets" for Jupyter support')
2026-05-29 11:33:34 INFO Sleeping for 5.0 seconds. Waiting and checking a function in a loop.
2026-05-29 11:33:40 INFO Sleeping for 10.0 seconds. Waiting and checking a function in a loop.
2026-05-29 11:33:51 INFO Sleeping for 15.0 seconds. Waiting and checking a function in a loop.
2026-05-29 11:34:08 INFO Sleeping for 20.0 seconds. Waiting and checking a function in a loop.
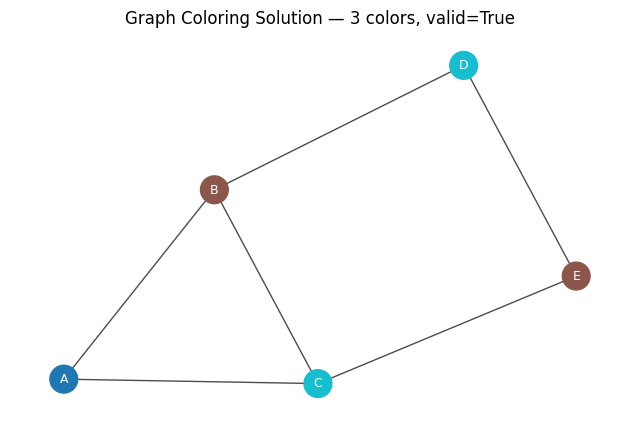
Graph Coloring Solution:
  Colors used: 3
  Valid: True
  Assignment: {'A': 0, 'B': 1, 'C': 2, 'D': 2, 'E': 1}
Plot Solution
Visualize the optimal solution.
Collections
Generate a benchmark collection of random instances for batch processing.
collection = GraphColoringCollection.from_random(min_nodes=4, max_nodes=6, n_colors=3, num_instances=2, seed=42)
model = collection.instances[0].formulate()
print(model)
Model: graph_coloring<graph_coloring>
Minimize

Subject To
  one_color_node_0: x_0_0 + x_0_1 + x_0_2 == 1
  one_color_node_1: x_1_0 + x_1_1 + x_1_2 == 1
  one_color_node_2: x_2_0 + x_2_1 + x_2_2 == 1
  one_color_node_3: x_3_0 + x_3_1 + x_3_2 == 1
  diff_color_0_1_0: x_0_0 + x_1_0 <= 1
  diff_color_0_1_1: x_0_1 + x_1_1 <= 1
  diff_color_0_1_2: x_0_2 + x_1_2 <= 1
  diff_color_0_2_0: x_0_0 + x_2_0 <= 1
  diff_color_0_2_1: x_0_1 + x_2_1 <= 1
  diff_color_0_2_2: x_0_2 + x_2_2 <= 1
  diff_color_0_3_0: x_0_0 + x_3_0 <= 1
  diff_color_0_3_1: x_0_1 + x_3_1 <= 1
  diff_color_0_3_2: x_0_2 + x_3_2 <= 1
  diff_color_2_3_0: x_2_0 + x_3_0 <= 1
  diff_color_2_3_1: x_2_1 + x_3_1 <= 1
  diff_color_2_3_2: x_2_2 + x_3_2 <= 1
Binary
  x_0_0 x_0_1 x_0_2 x_1_0 x_1_1 x_1_2 x_2_0 x_2_1 x_2_2 x_3_0 x_3_1 x_3_2